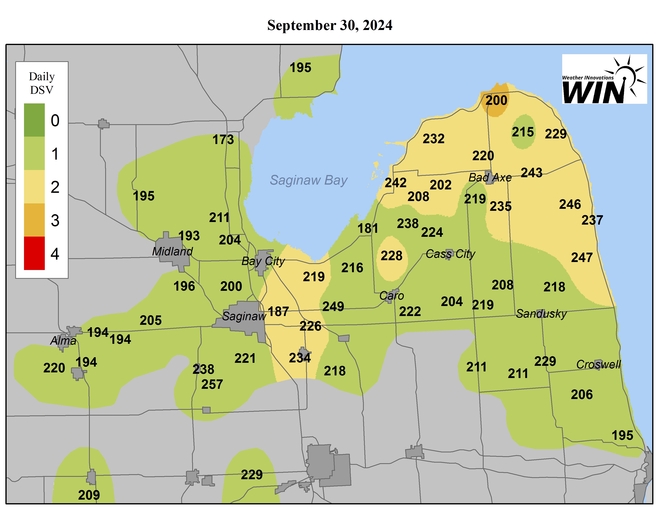
DSV MapsBEETcast™ rates each day on a scale of 0 to 4 with a value of 4 indicating the weather conditions were very favourable for the disease while a 0 indicates that either the number of hours the leaves were wet was low or the temperature was too cool for the leafspot disease to grow. These daily disease severity values (DSVs) are accumulated daily until a threshold is reached, indicating a spray application is appropriate. You then zero your counter and apply additional sprays based on the next interval of cumulative DSVs. Numbers on map represent DSV accumulated from May 15th. |
Remaining Dates Listed Below
 |
BEETcast™, SPRAYcast® are trademarks of Weather INnovations |
|